trend spy
a market-research platform for small businesses, designed and built end to end. shipped jan 2026, live at trendspy.app.
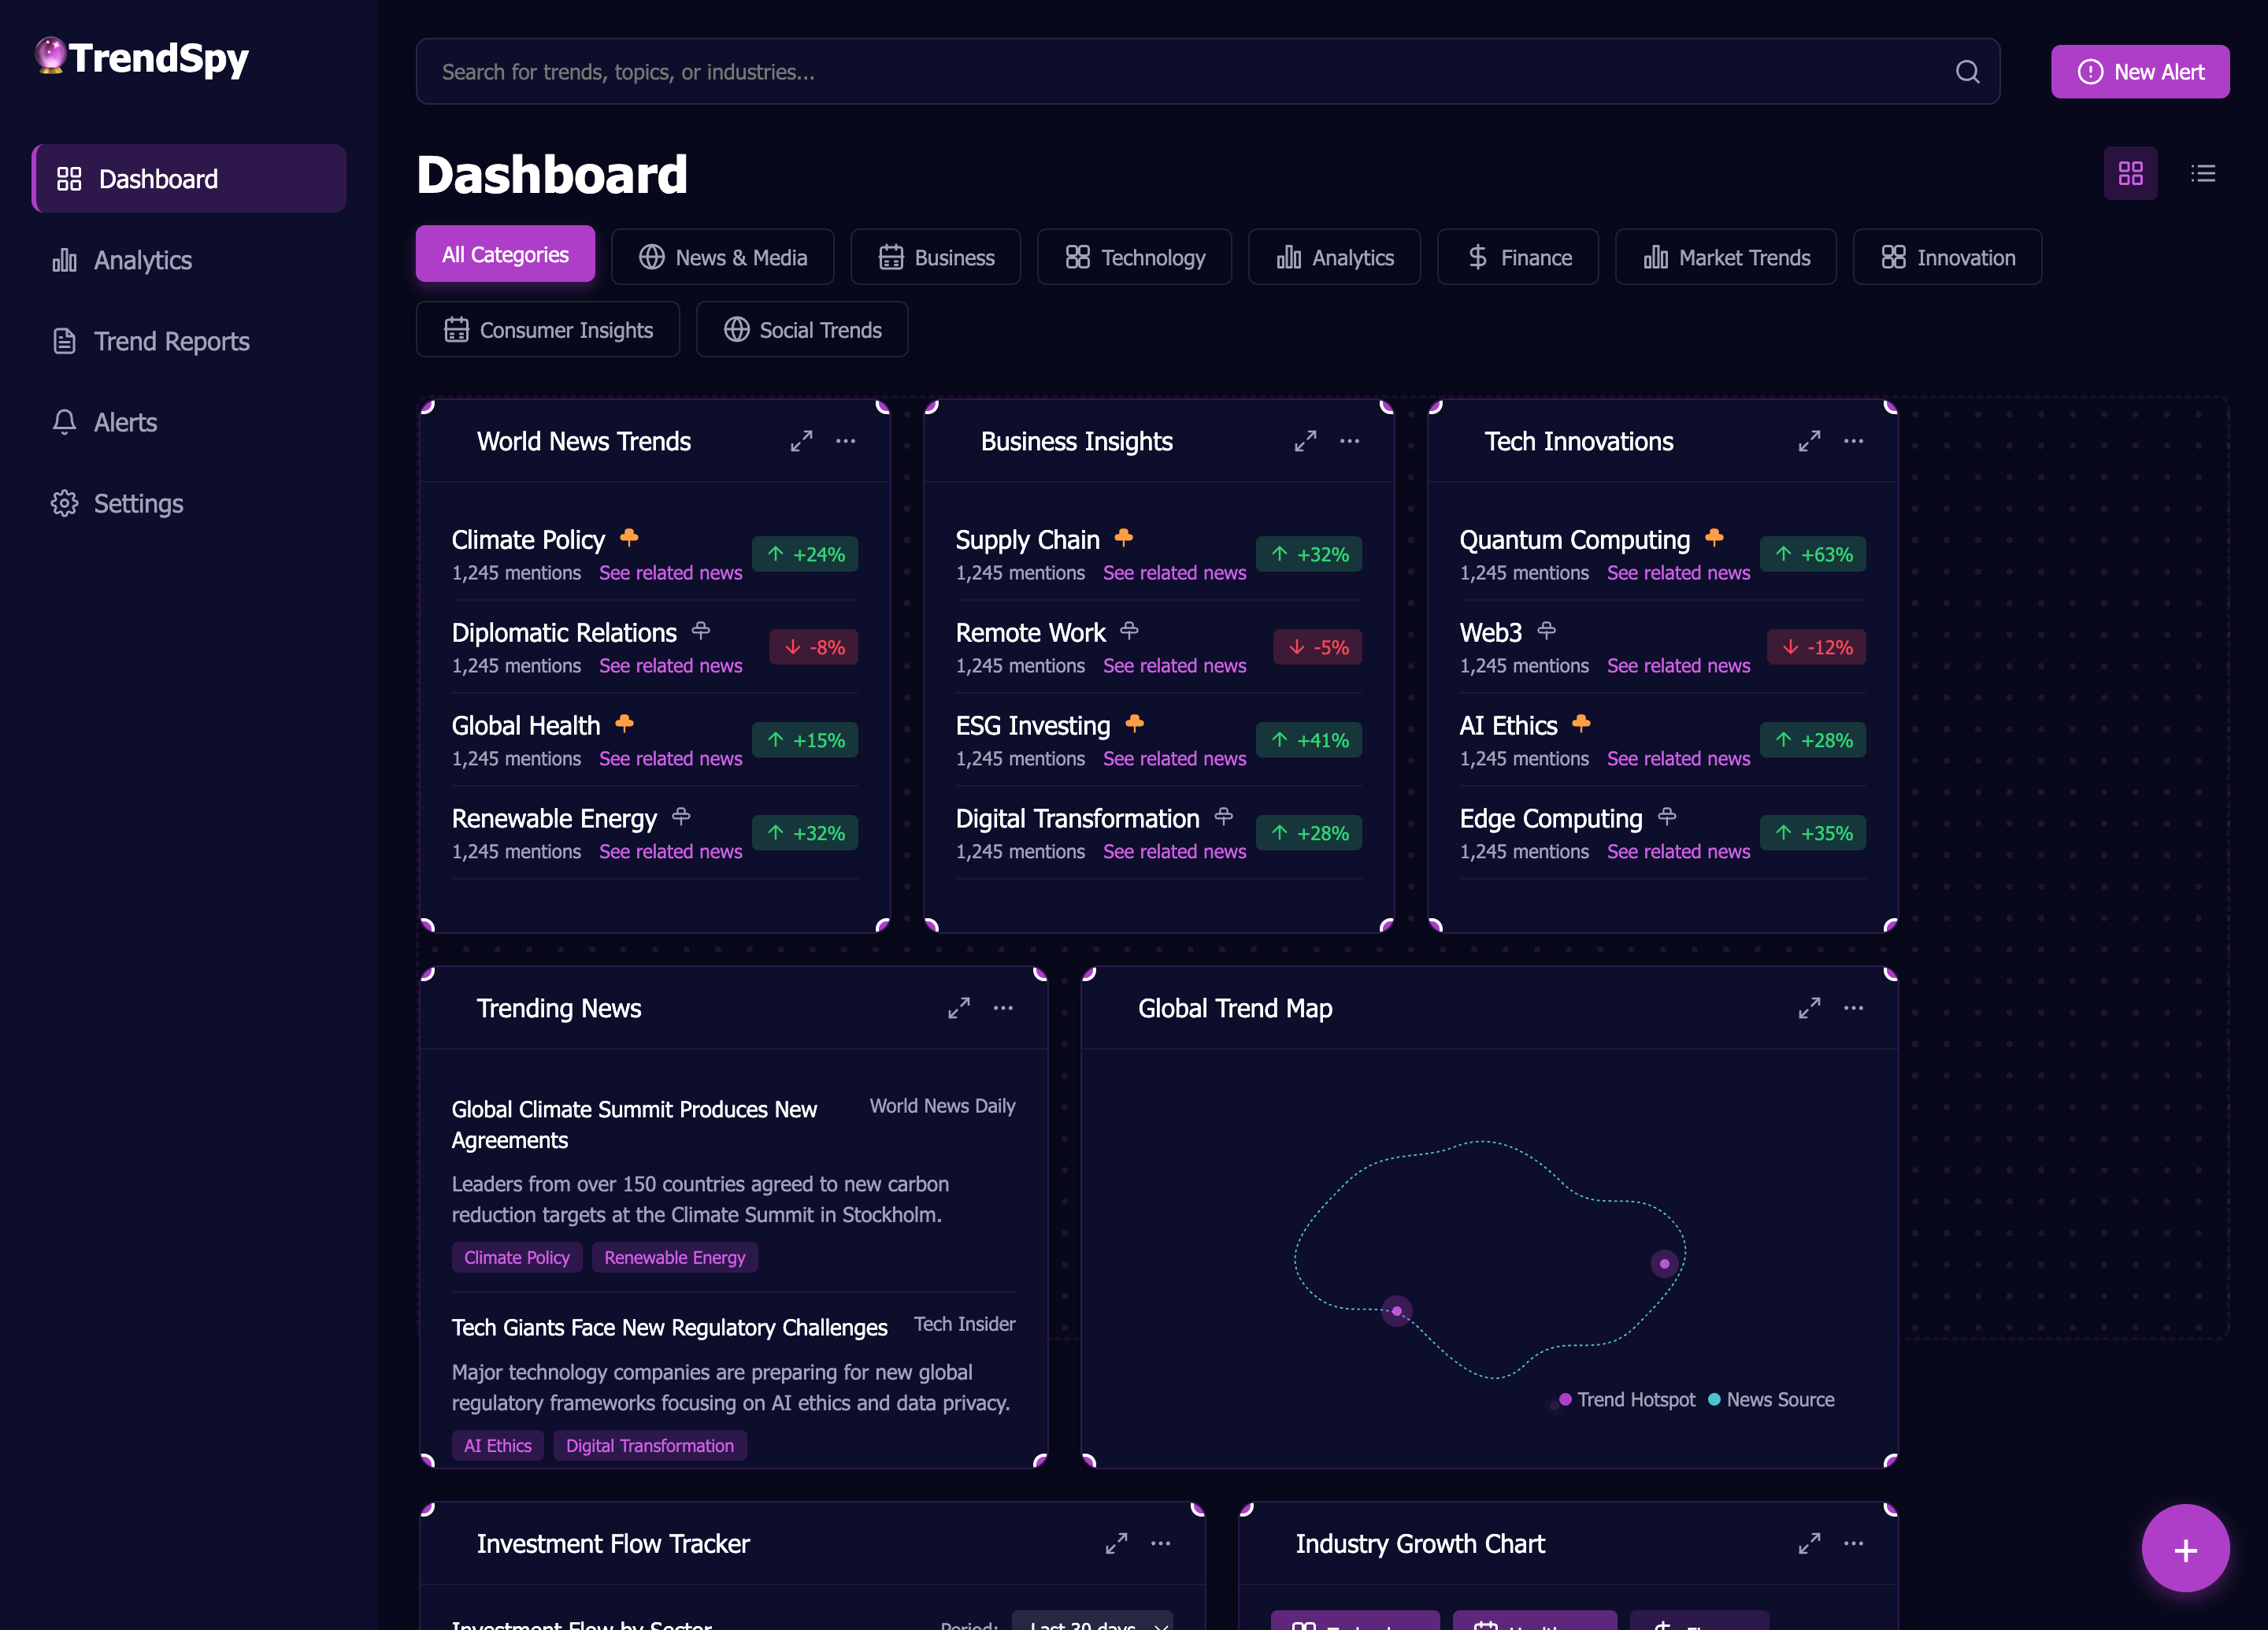
a market-analysis platform for small businesses that consolidates fragmented research tools into one dashboard, with an ai assistant on top.
led research (12 interviews, 6 companies), built the 15-component design system, and developed the react/typescript front-end myself.
shipped. live at trendspy.app. sixteen months from first interview to launch, aug 2024 – jan 2026.
small businesses struggle with fragmented market research tools, leading to missed opportunities and time-consuming analysis across multiple platforms.
how might we create a unified solution that helps businesses identify market opportunities more efficiently?
trendspy consolidates data from multiple sources into one interface: personalized dashboards, trend tracking, and ai-powered insights tailored to the business.
- competitive analysismany solutions existed; none were a truly unified, affordable platform designed for small-business workflows.
- 12 stakeholder interviews6 companies (2 startups, 2 small businesses, 2 mid-sized), 45 minutes each. users were spending significant time weekly on analysis, much of it wasted switching platforms and consolidating data.
- workflow observationmultiple platforms for single tasks, manual copy-paste between tools, inconsistent formats, constant context switching. users had built complex workarounds that were slow and error-prone.
i copy-paste between 5 different dashboards daily. it's killing my productivity.— marketing lead, tech startup
we're paying for features we never use. i just need a simple way to track across platforms.— small business owner
i organized the complex data ecosystem into an intuitive structure and validated it with card sorting: topic-based organization beat source-based categorization. the final ia prioritizes users' mental models over technical data organization.
status legend across the ia: designed only · react implemented · not yet designed · future.
TRENDSPY
├─ authentication ─ login · onboarding
├─ dashboard ─ widget grid · drag & drop
│            real-time data · filtering
├─ widget library ─ catalog · previews
│                  custom builder
├─ trendy (ai) ─ chat · business context
│               recommendations · history
├─ user profile ─ company · goals · sources
├─ analytics ─ reports · predictive · export
├─ alerts ─ rules · email/sms · slack
└─ settings / admin ─ team · api · billing
a figma design system with 15 reusable components: data-visualization components tuned for trend analysis, consistent navigation, wcag 2.2 built into every component, responsive behavior across devices.
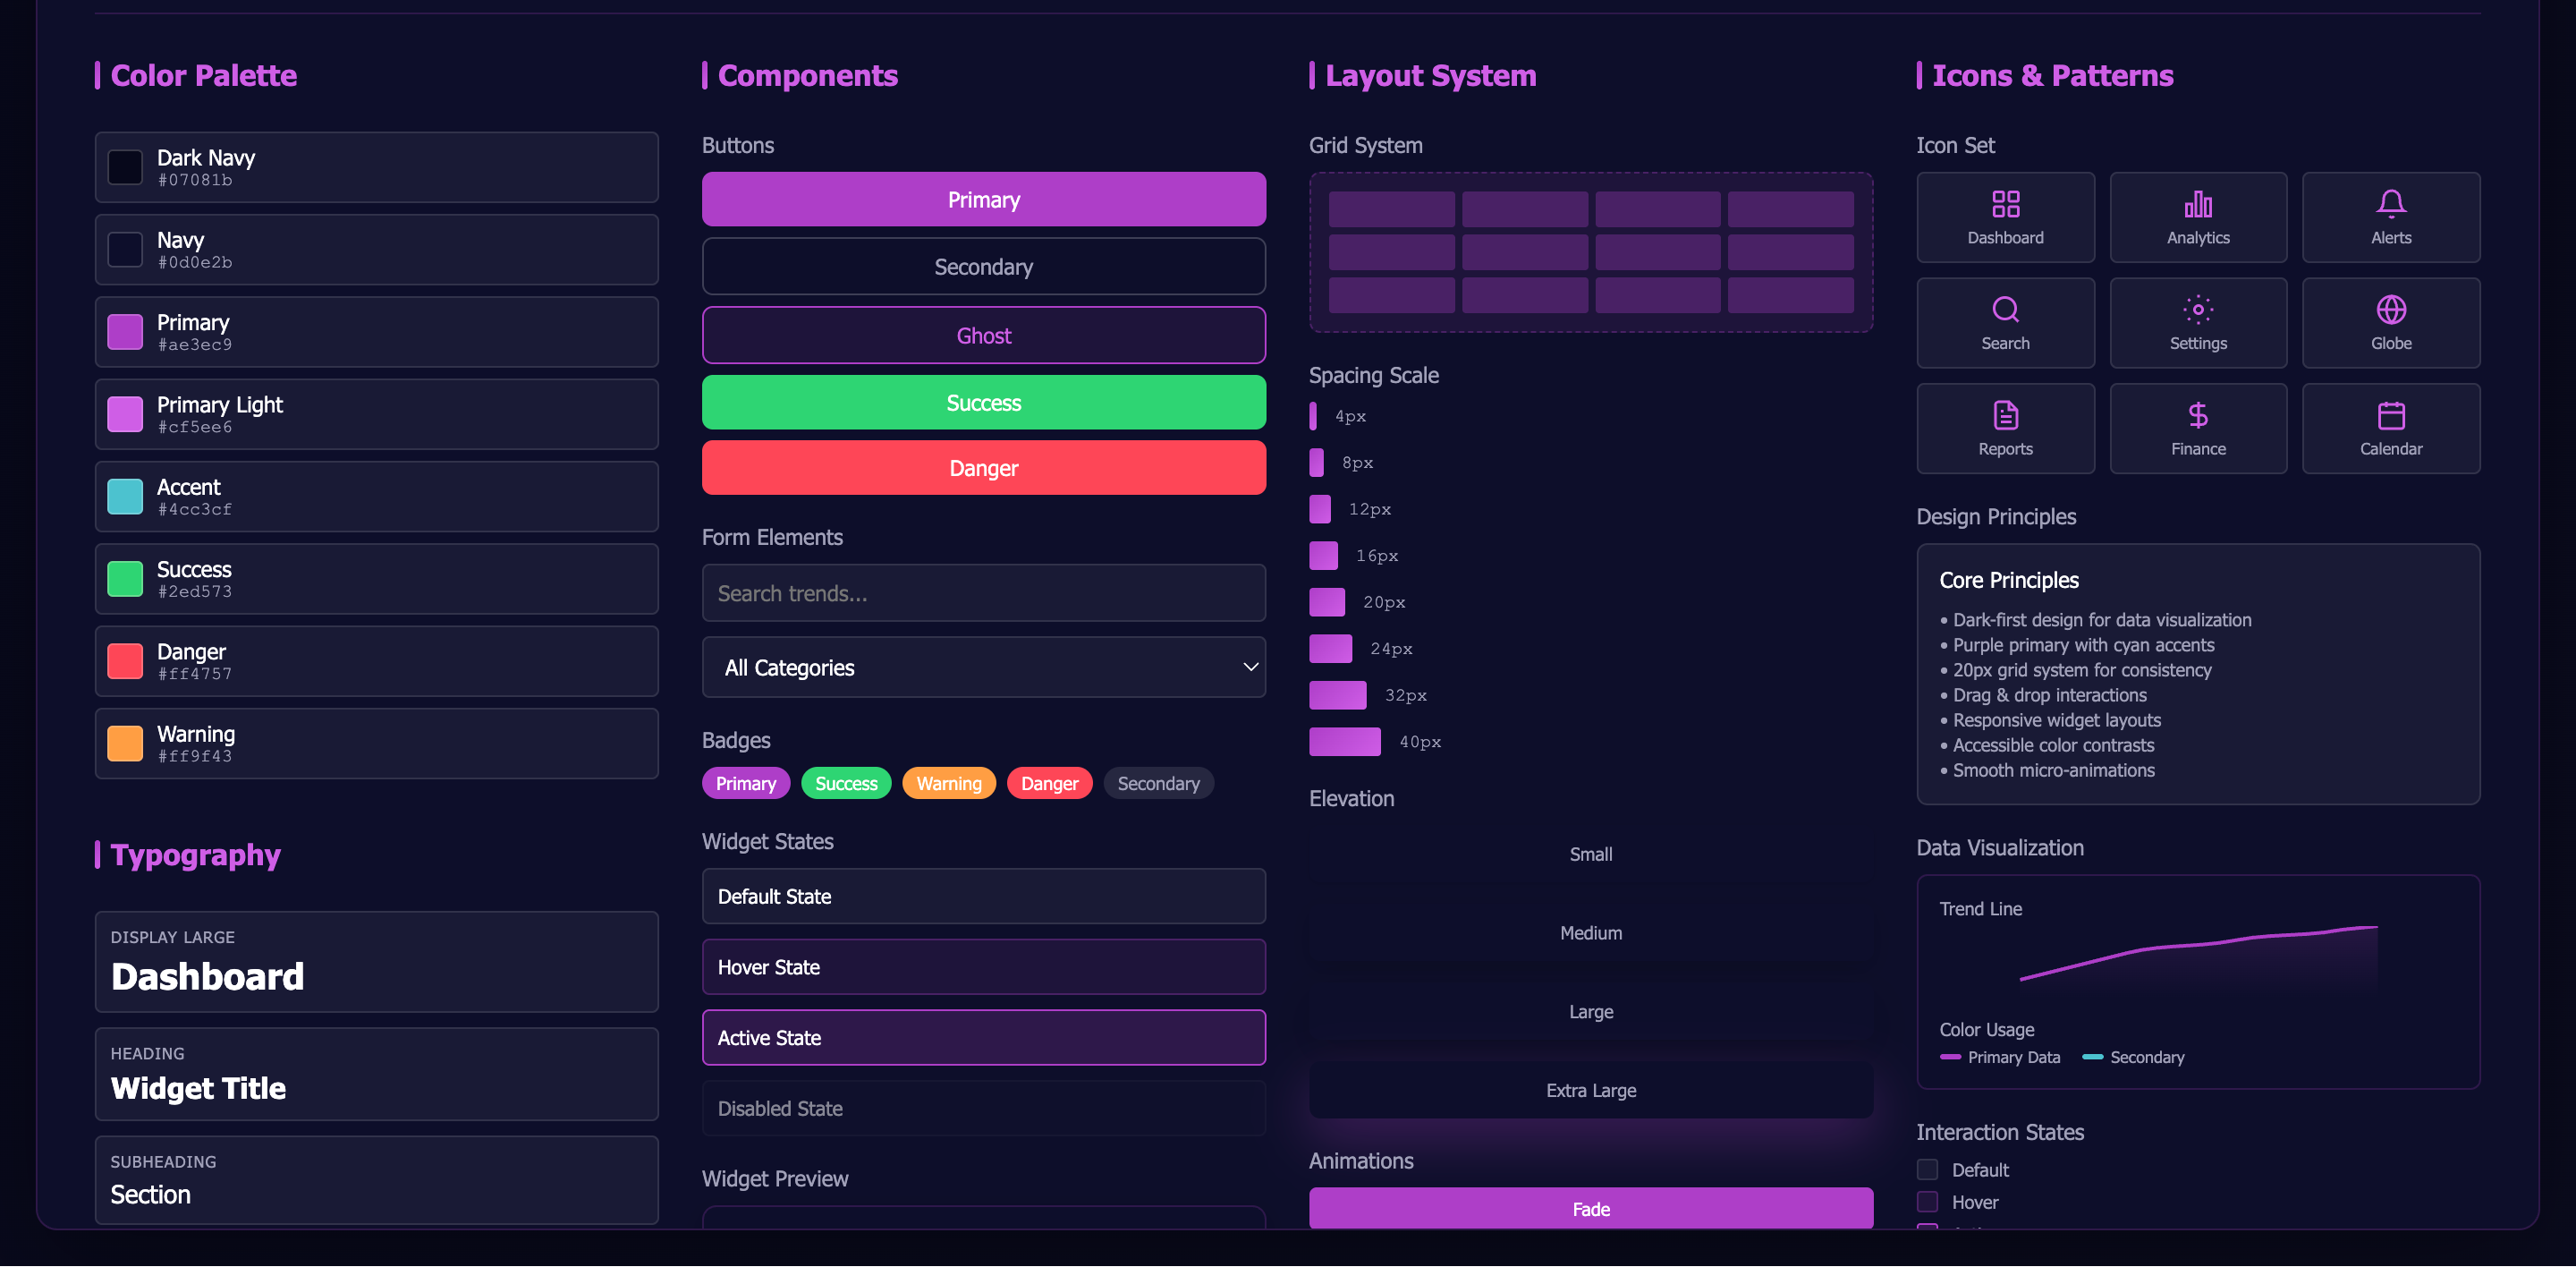 design system components
key journeys mapped from login to actionable insight, with decision points and the optimized path. wireframes for the four core surfaces: dashboard, profile, widget library, and the ai assistant.
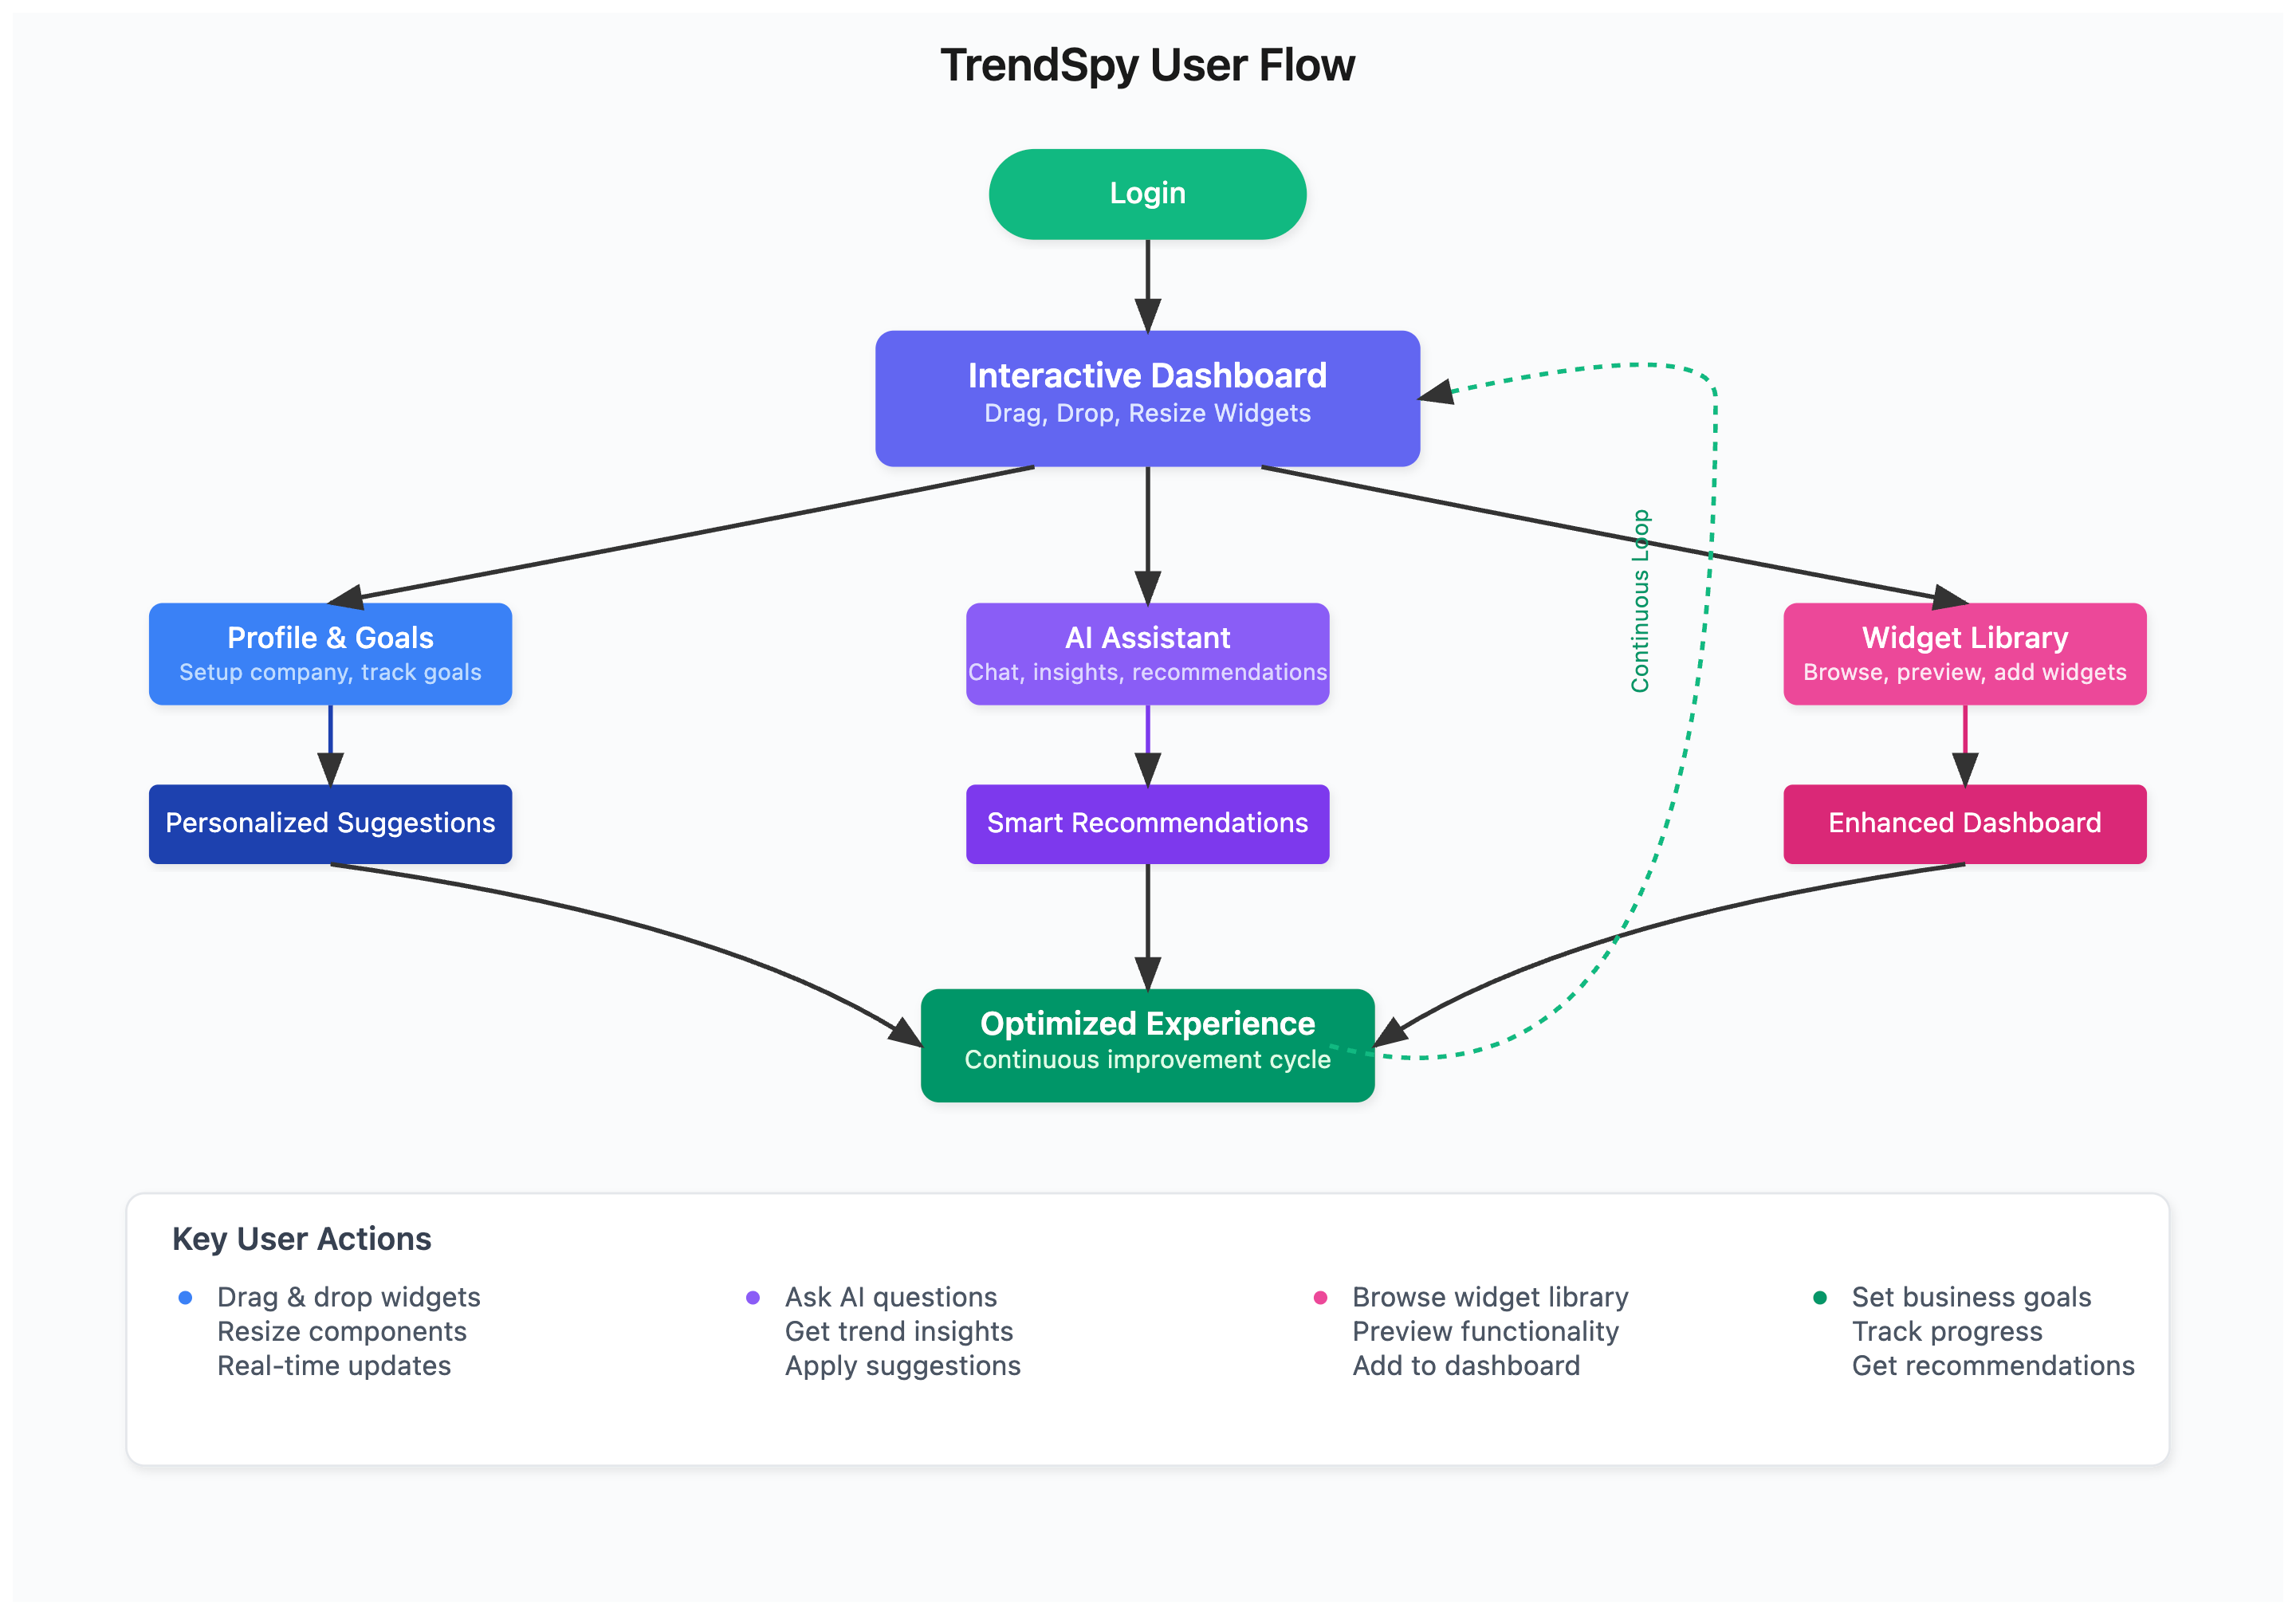 user flow · core analysis journey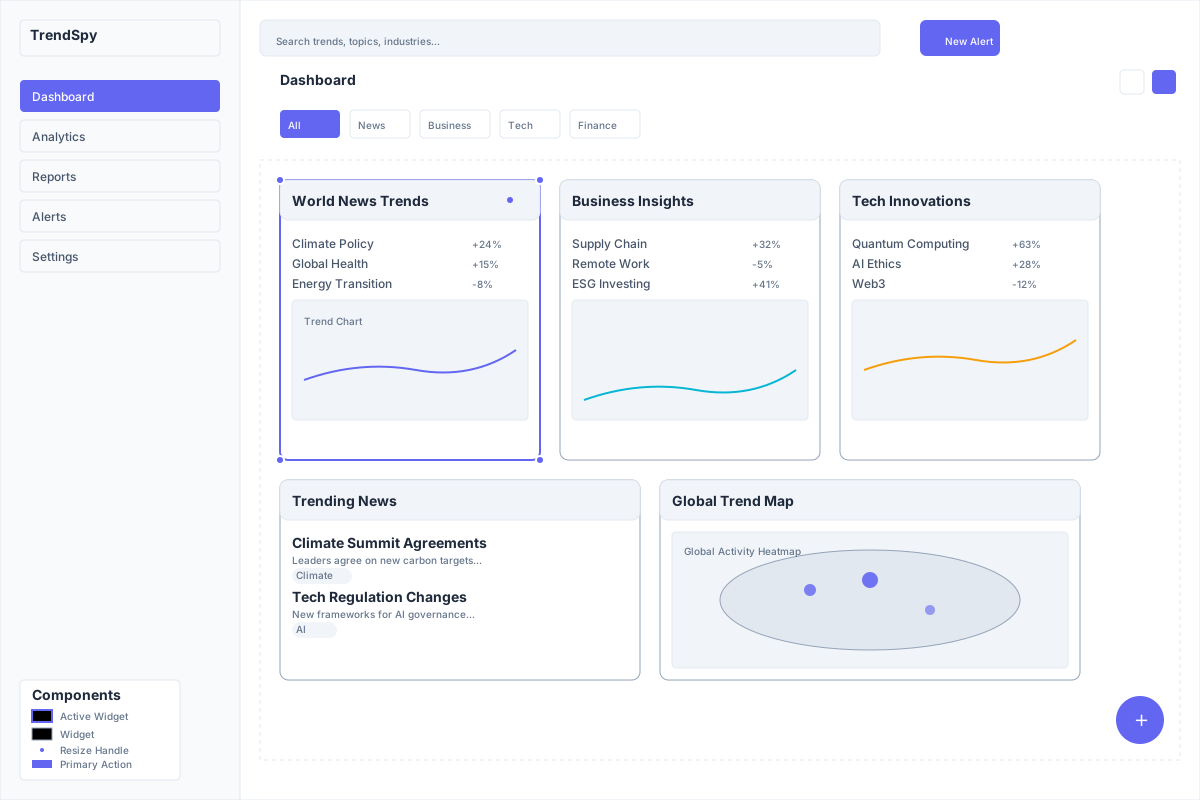
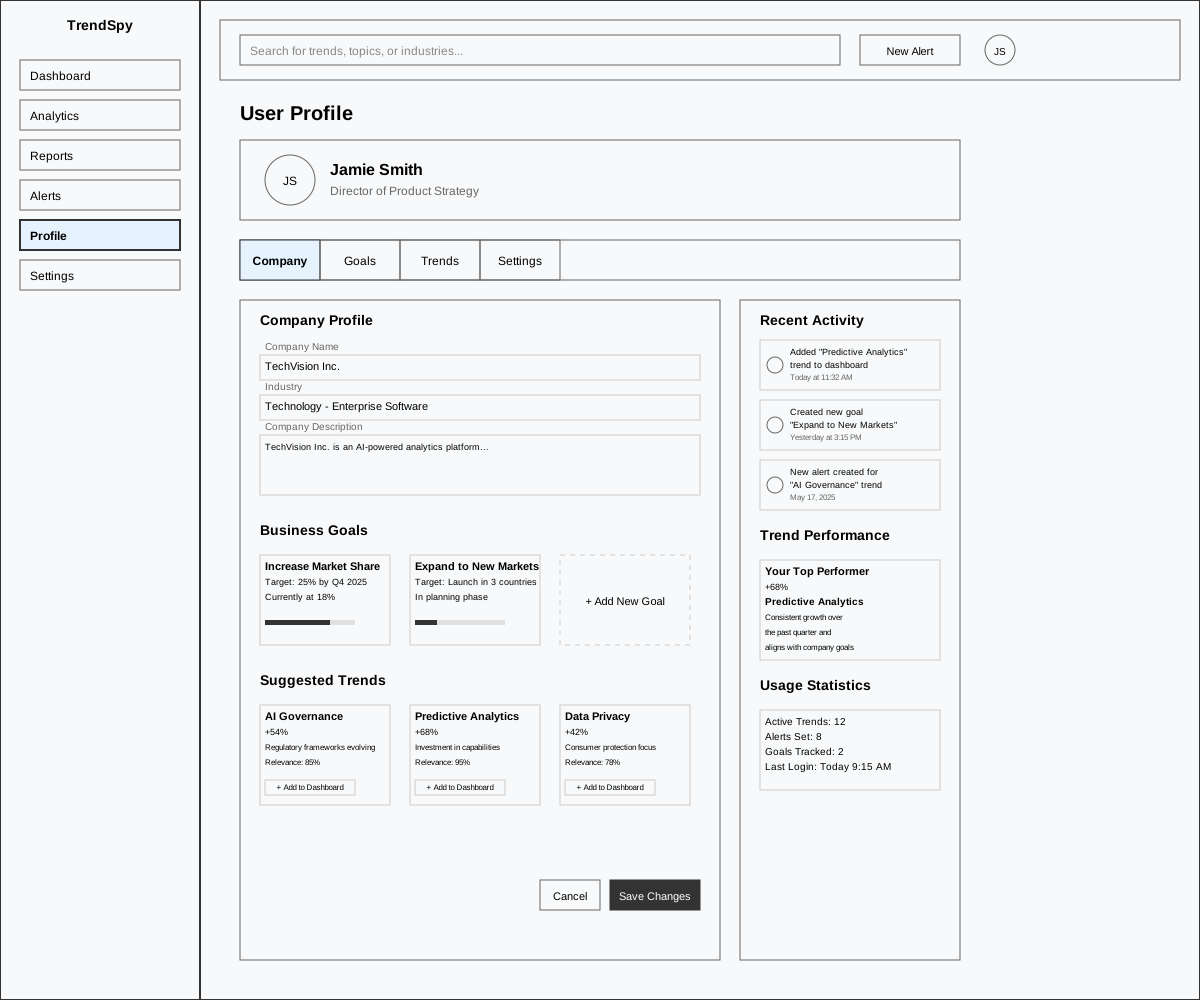
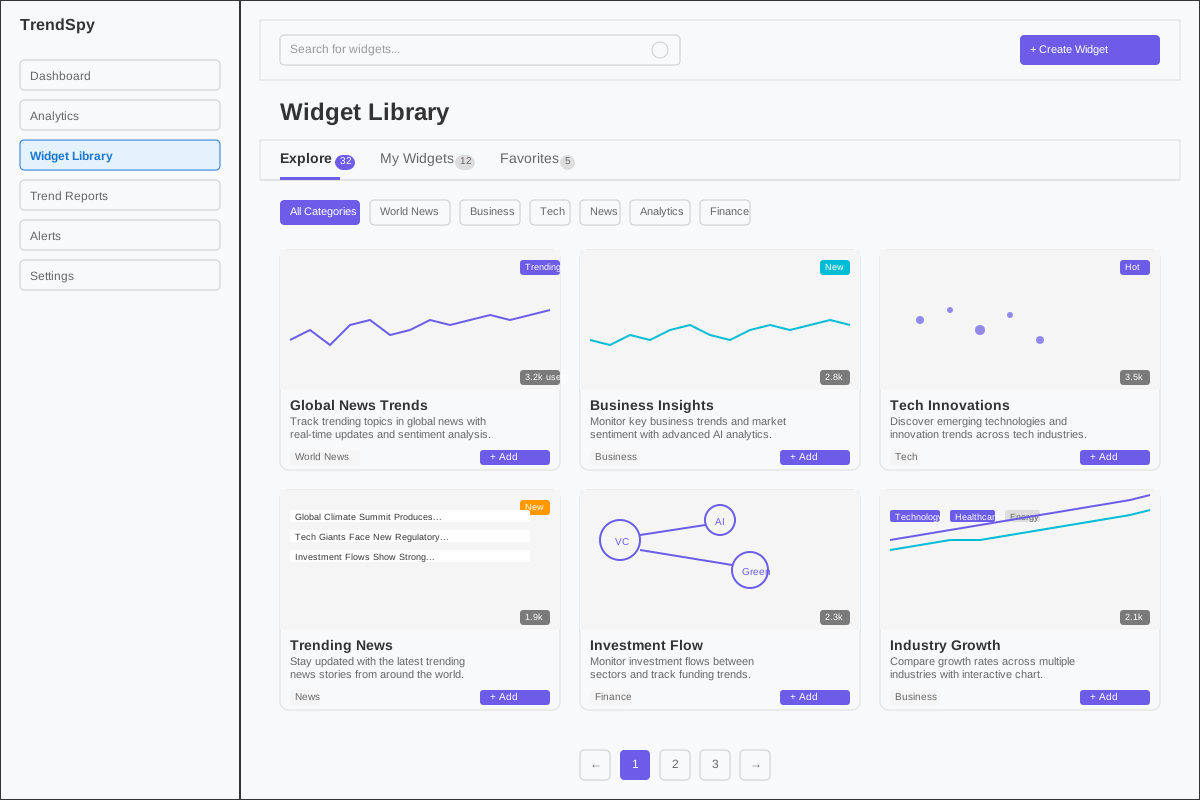
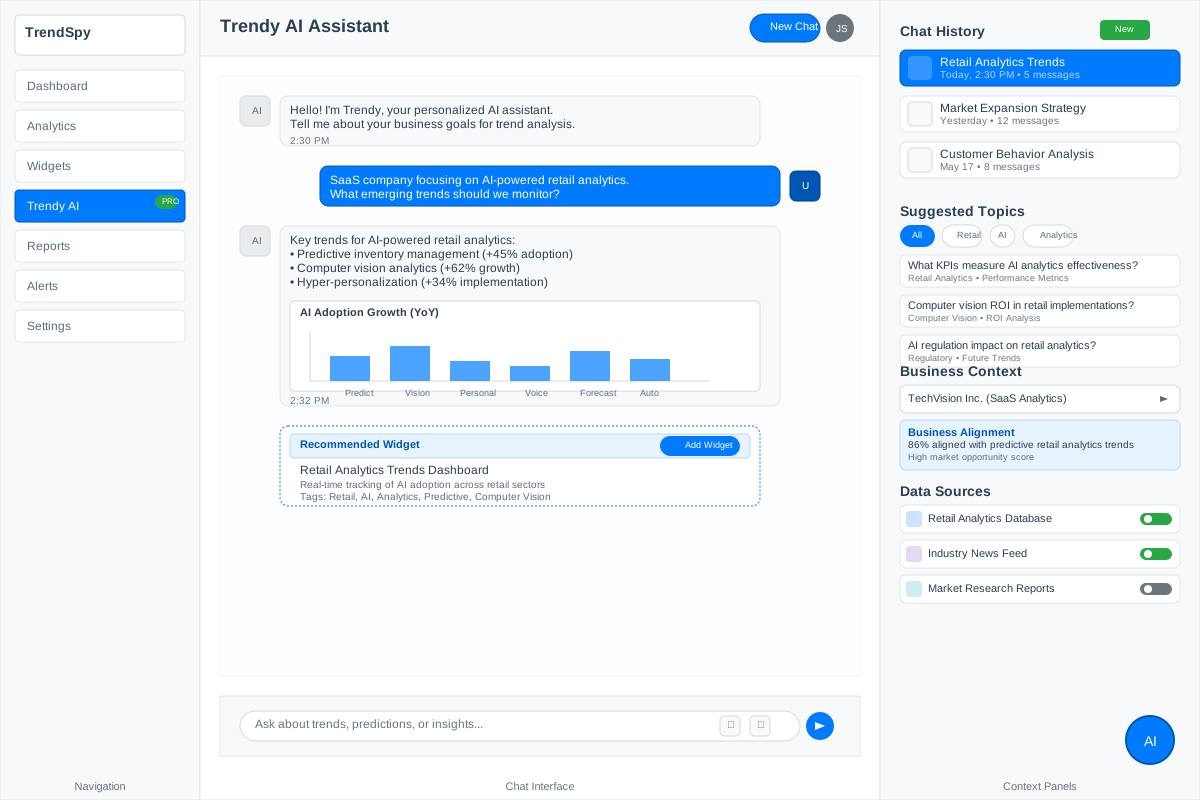
four components that answer the four findings: real-time tracking (cross-platform aggregation, visual trend indicators, configurable alerts), a discovery engine (industry-specific filtering, opportunity scoring, trend maps), historical analysis (interactive time-series, pattern highlighting), and ai insights (natural-language q&a, data interpretation, conversation history).
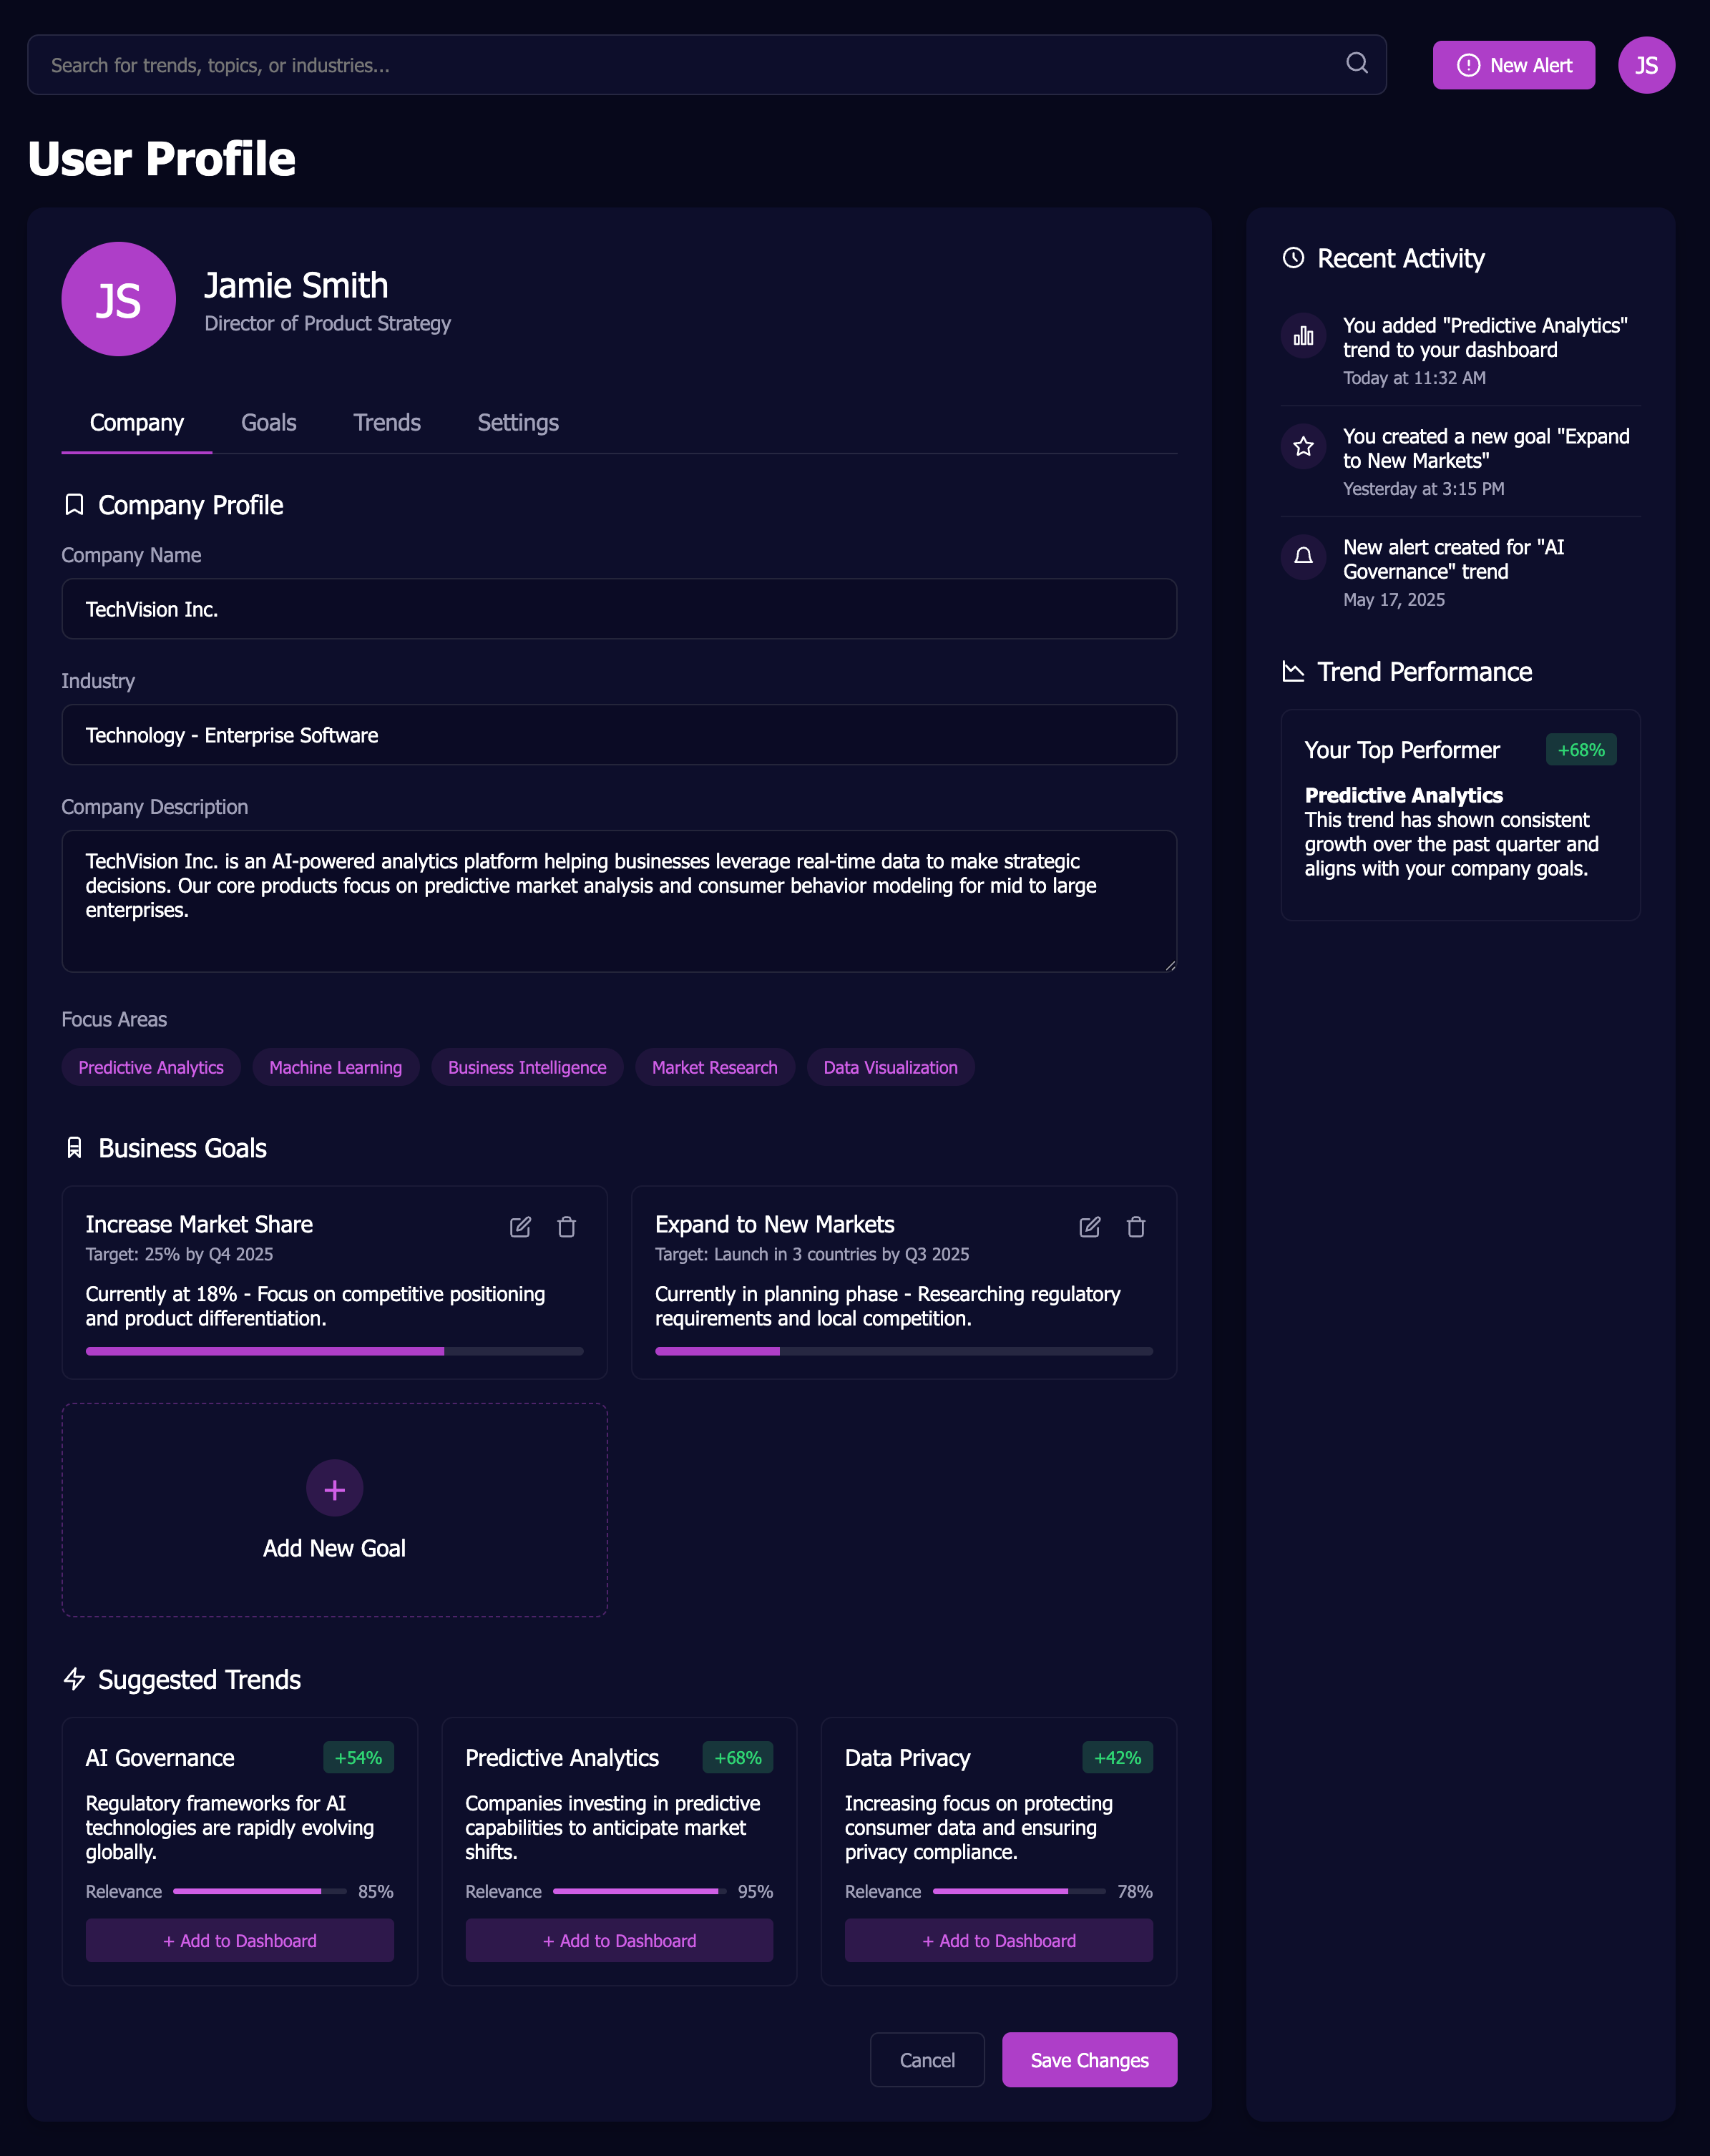
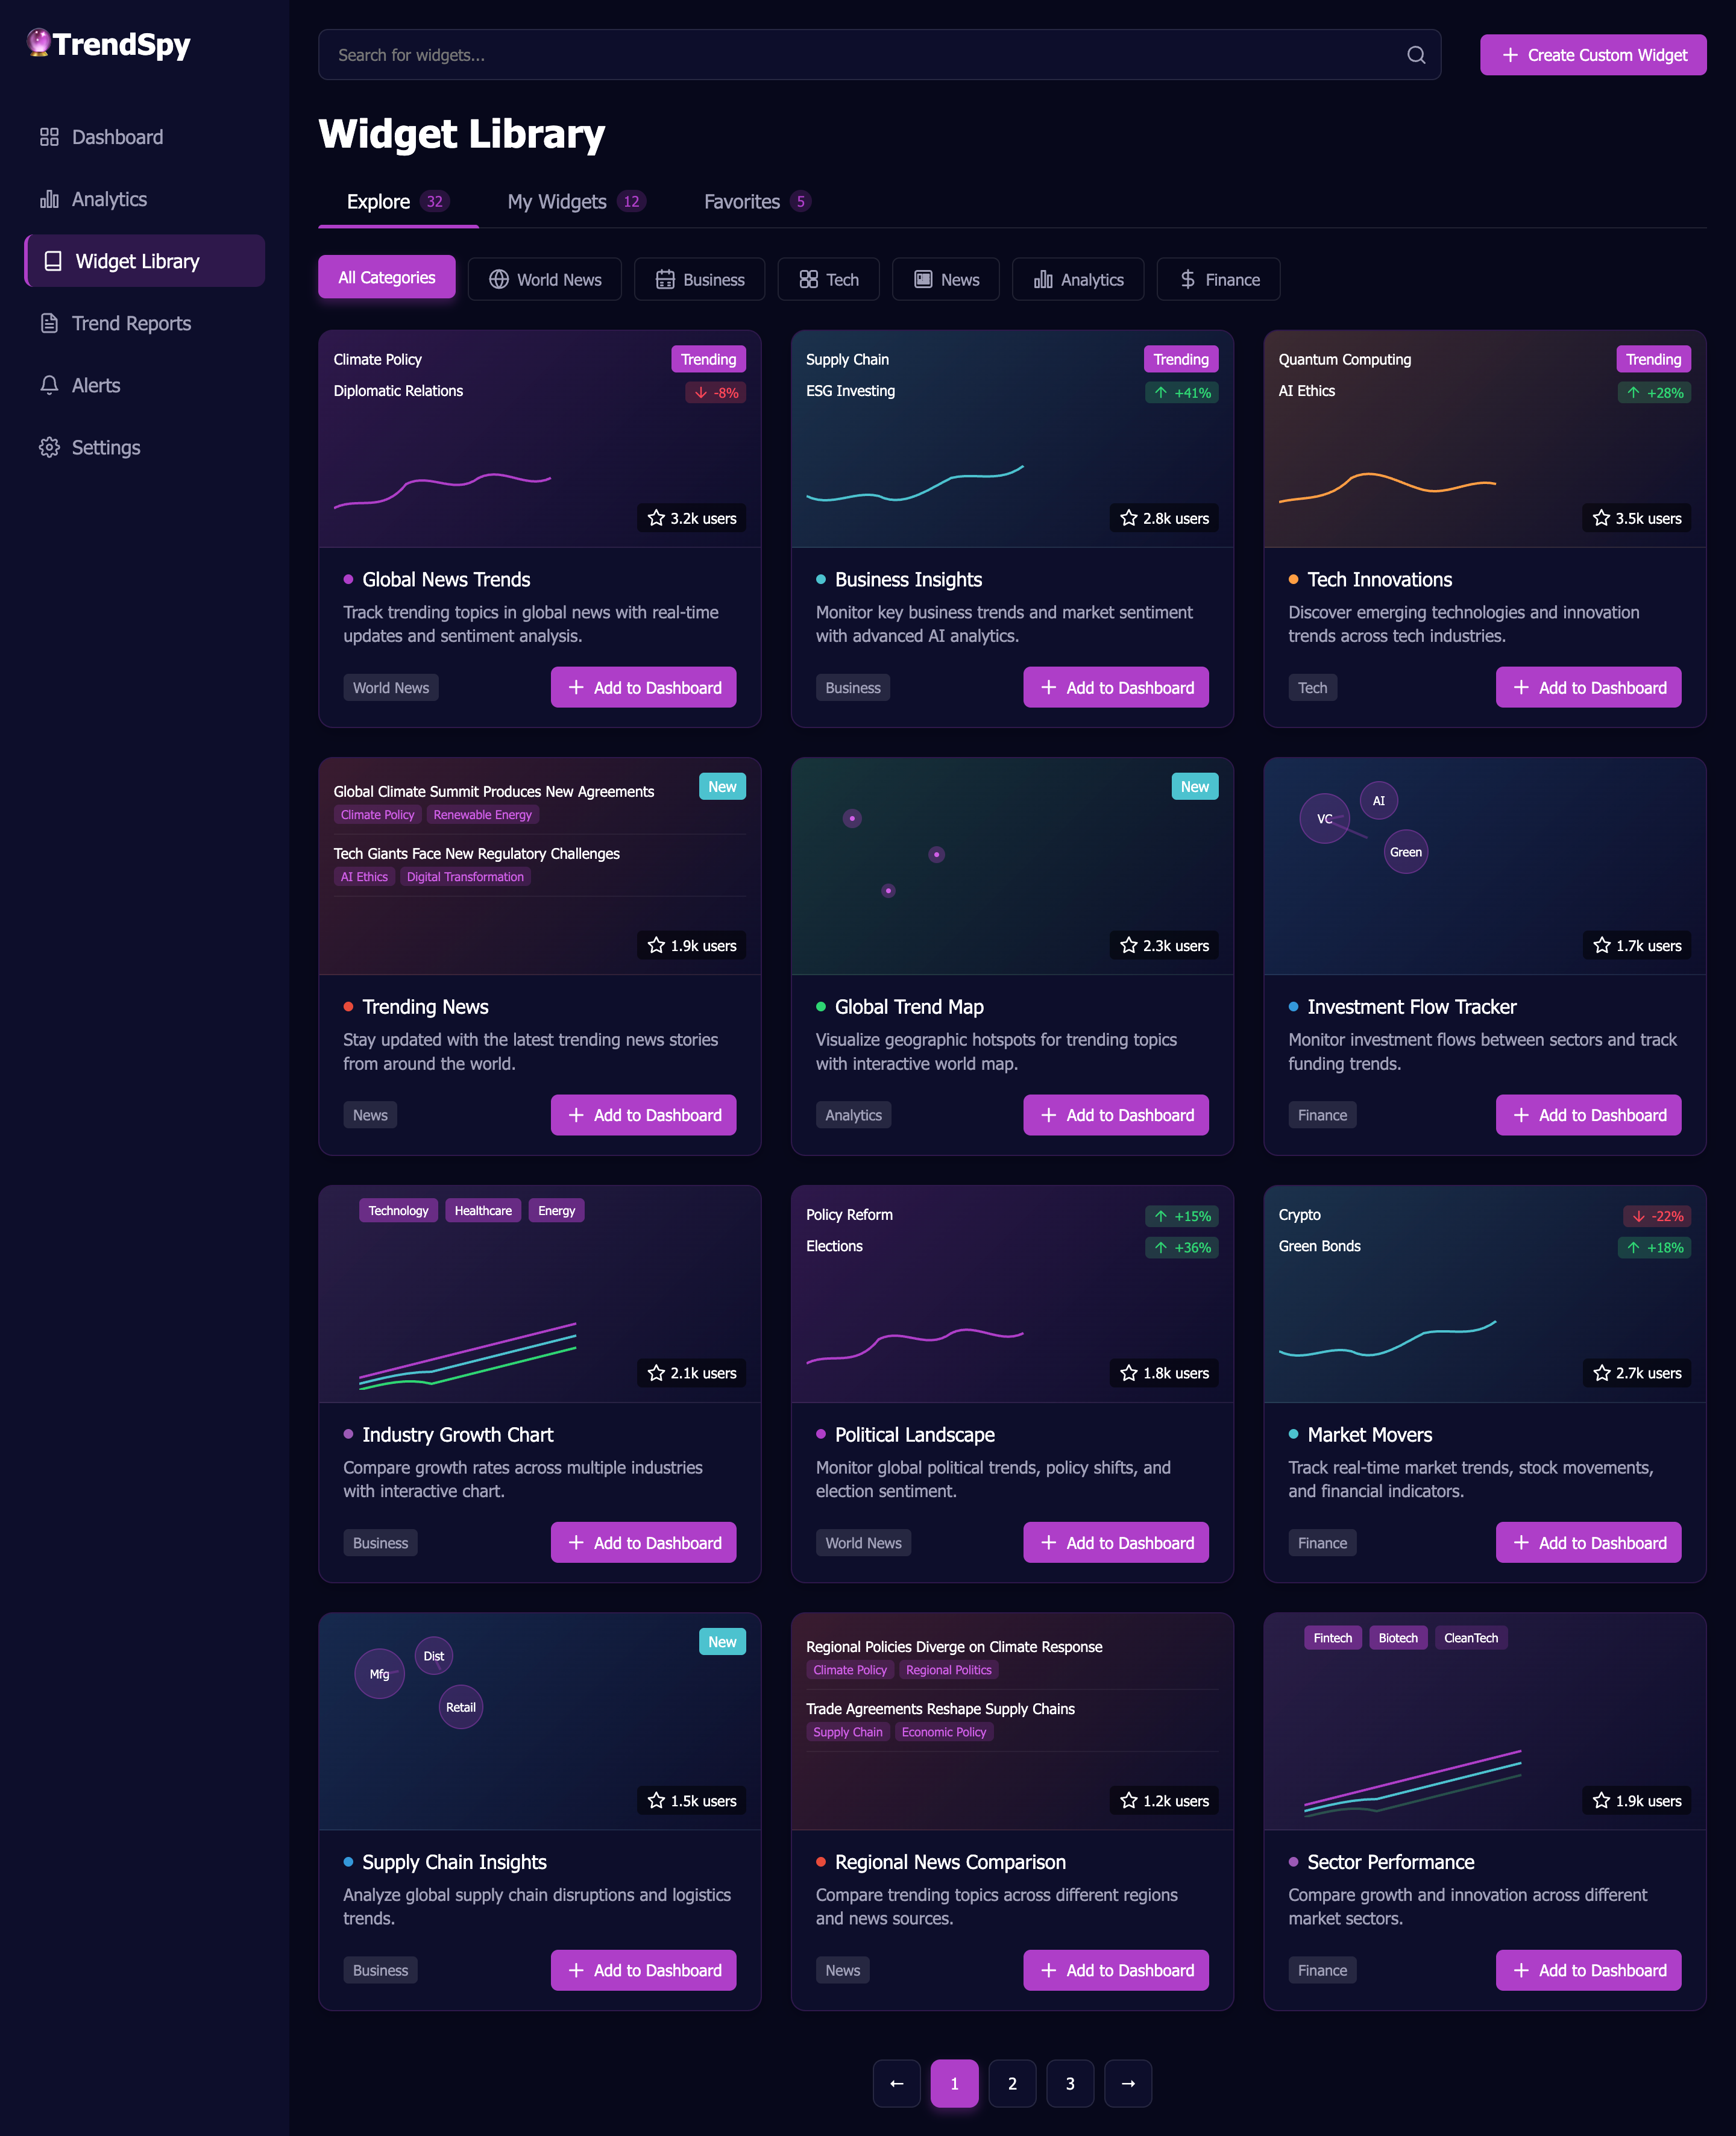
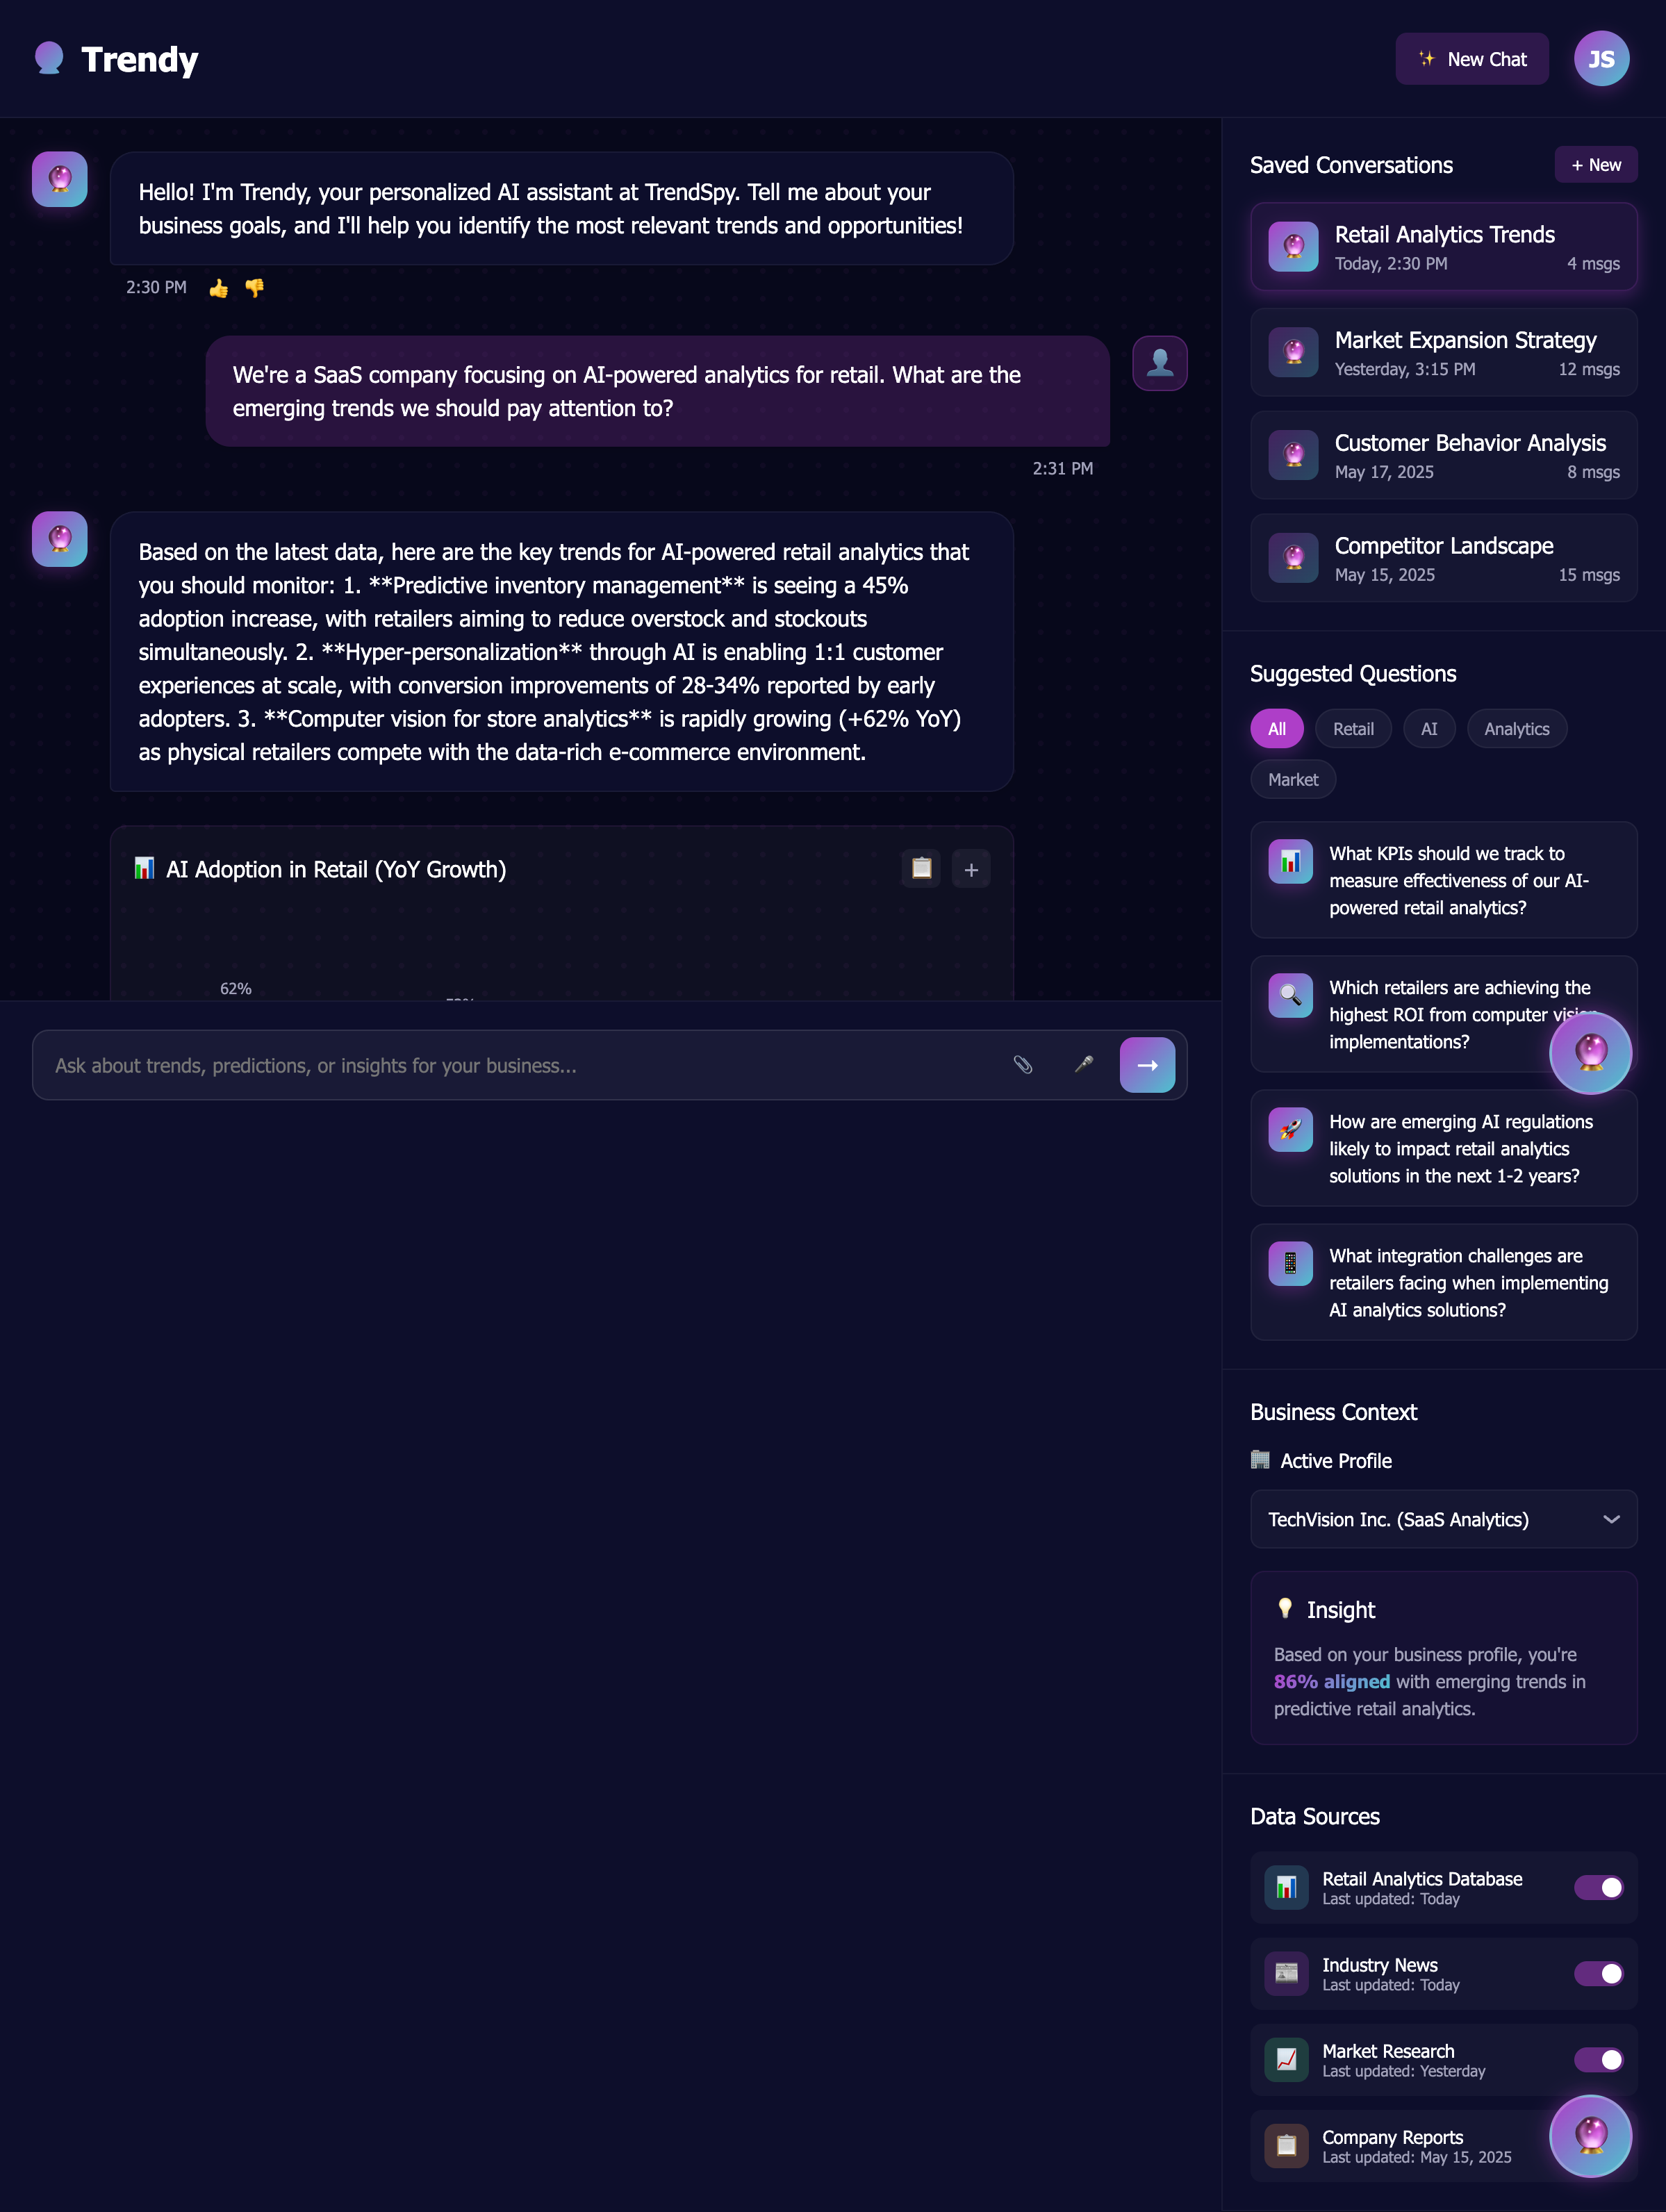
- company profile + industry settings
- business goal tracking with progress
- personalized trend recommendations
- activity + analytics preferences
customizable analysis components combined into personal dashboards: market data, social analysis, industry metrics. modular flexibility, one consistent interface.
ask questions in natural language, get analysis based on your own data. conversation history is saved, so the assistant slowly becomes a knowledge base.
as both designer and developer, i translated the validated designs into the production react application that ships today. design tokens come out of figma as css variables and component props; components mirror figma properties with typescript interfaces; everything shipped with tests and an accessibility pass.
- react + typescript
- styled-components with design tokens
- react query for api state
- d3 for custom visualizations
- jest + react testing library
- component-based, performance-first, mobile-responsive, accessibility-native
- live — trendspy.app, launched jan 2026
- in the product — design system, dashboard, widget library, ai assistant, profile system, react front-end
- what i'd build next — alerts/notifications (needs research), advanced reporting, settings
- aug 2024research: audit, 12 interviews, workflow observation
- winter 2024ia, card sorting, design system, wireframes
- 2025prototypes, testing, react implementation
- jan 2026launch
some details of trendspy's proprietary technology and business strategy are omitted here. happy to go deeper in conversation under an appropriate agreement.